Part 1: We Begin ➤
I have a lot of experience teaching physics to students who are not very math savvy. The first hurdle is getting them to understand that we don't have to always use 'x' and 'y' as unknown variables. In physics we end up using every letter in the alphabet (and begin resorting to letters from the Greek alphabet!) The unknowns are actually various measurable physical quantities, rather than abstract variables.
So the letters are abbreviations, and have meaning. The equation using these defined variables is thus defining a relationship among the variables, and this relationship is not just an equation, it is also a sentence. Equations are sentences. Equations in physics are also often definitions. One of the variables is defined by the other variables. Which are, in turn, defined by yet more variables.
We start with the basics - time, space, and mass. Time is time, it just keeps on ticking regardless. (In the Newtonian sense, mind you, not relativistically - that's a whole other story!) Space is something you can reliably measure with a ruler, and mass is simply the amount of stuff you are made of. On these basics we start building sentences.
• • •
Equations are not the only way to represent interactions in the physical world. We can build equations from our measurements, but we can also represent relationships among quantities with graphs. Graphing will result in shapes that can also be read. Learning to both construct and read graphs is an important skill in physics. In this collection of posts I want to explore a world of diagrams that I feel belong on the physics shelf alongside equations and graphs.Part 2: The Triangle ➤
Here's a typical physics equation:
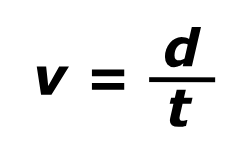 Written this way it is a kind of diagram. I instruct the students to read the sentence: velocity is distance over time. In fact, this is the definition of velocity. But what does "over" mean? It means we divide, distance by time. So the horizontal line always means division. How many variables? Three. So that's how many ways can we write the equation. Let's try all three versions:
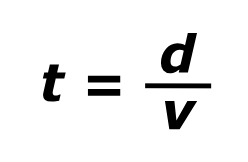
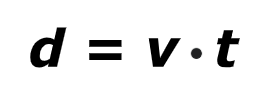
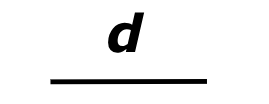
What variable is ever underneath? One of the other two variables, v and t , depending on the version. So we put both v and t underneath d :
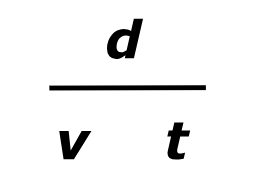 But what are v and t doing? Look at that last version of the equation - they are being multiplied. So we could write some multiplication sign between them. Multiplication is often indicated with a dot, so we could put a big dot there:
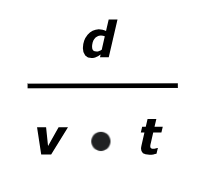 Or we could draw a vertical line and connect it to the horizontal line:
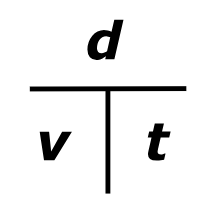 We now have a different way to diagram the equation. We can stop here, but I usually enclose the whole diagram in a triangle:
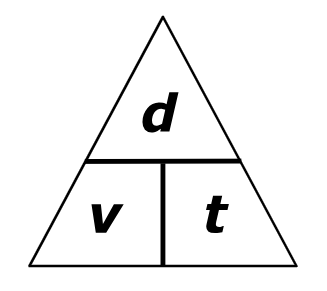 Some people prefer a circle, or you could just eliminate the triangle, which some students prefer.
• • •
Here's how it works: you decide which variable you are solving for, place your finger over that variable, and compute using the remaining two variables according to what the triangle suggests. You are not limited to equations with three variables. I've seen triangles and boxes designed for four or more variables.I have sometimes been asked whether or not using the triangle is some kind of cheating. Based on how students react, I've certainly discovered that it's easier for the students to learn. Some of my more advanced students find it unnecessary. But the triangle is a legitimate representation. If I present it as an equation (as I eventually do for all my students), you'll see:
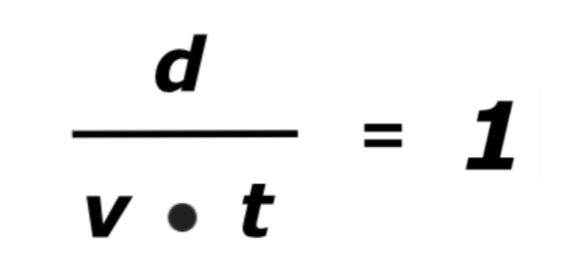 The triangle is a helpful graphical device as well as a valid mathematical representation. We'll use the triangles (as well as graphs) to explore how we talk about, measure, and calculate motion (kinematics).
Part 3: Interactions ➤
Before getting to the topic of energy, we spend a lot of time on momentum, momentum transfer, and momentum conservation. Momentum is a measure of how massive something is combined with how fast it is moving. The triangles continue working well, even when things start to get complicated. In addition, we stage a variety of interactions (collisions and explosions) as part of exploring momentum conservation. The staging of collisions can be done on paper (both as calculations and graphs), but of course they are much more fun when you have actual objects colliding.
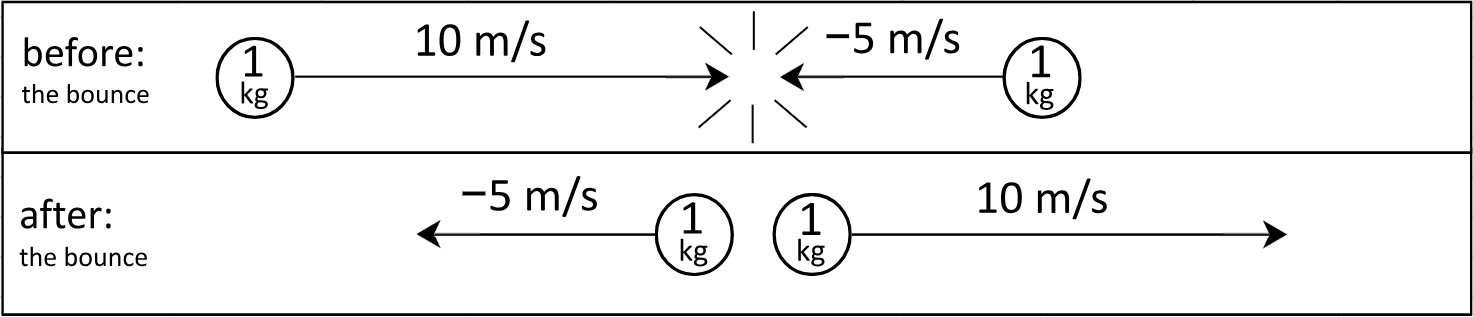
After colliding, the objects either stick together (inelastic) or bounce (elastic). A bounce, by the way, is a kind of explosion. Eventually we explore the concept of momentum conservation. All this work will come in handy when we eventually get to energy and energy conservation.
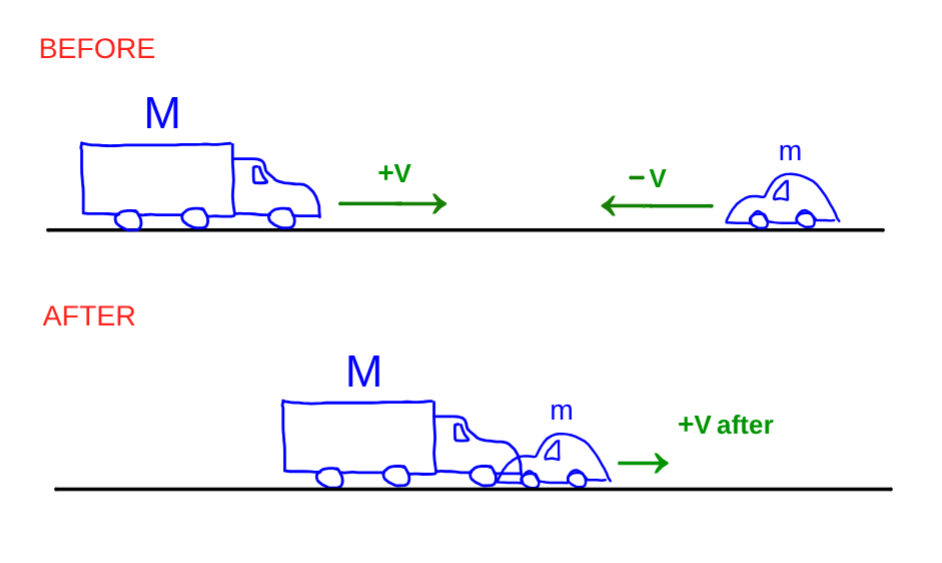
What is a good diagram to represent momentum? Because momentum has both magnitude and direction, an arrow is a perfect representation. The longer the arrow, the more momentum. The arrow points in the direction of the momentum. In fact, you can examine momentum interactions (like a collision, for instance) with arrows, and by carefully plotting the arrows on a grid, you can actually do the math with the arrows. Here is a staged collision as a diagram:
 Here's another kind of diagram, still using arrows, to represent an interaction:
 One activity I use with my students is literally "doing math with arrows" by using colored paper tape to indicate the momentum of a swimmer. We go out into the hallway, which is conveniently tiled rectilinearly, and take advantage of the grid to create one arrow on the floor for the swimmer and a second arrow for the water current. We set the speed and direction of the current as a constant, and the student teams set the speed and direction of their swimmers. Using arrows, they construct parallelograms to show where the swimmer will actually go and at what speed. Everyone loves this, and I'll leave the tape diagrams on the floor for a while so the whole school can see them.
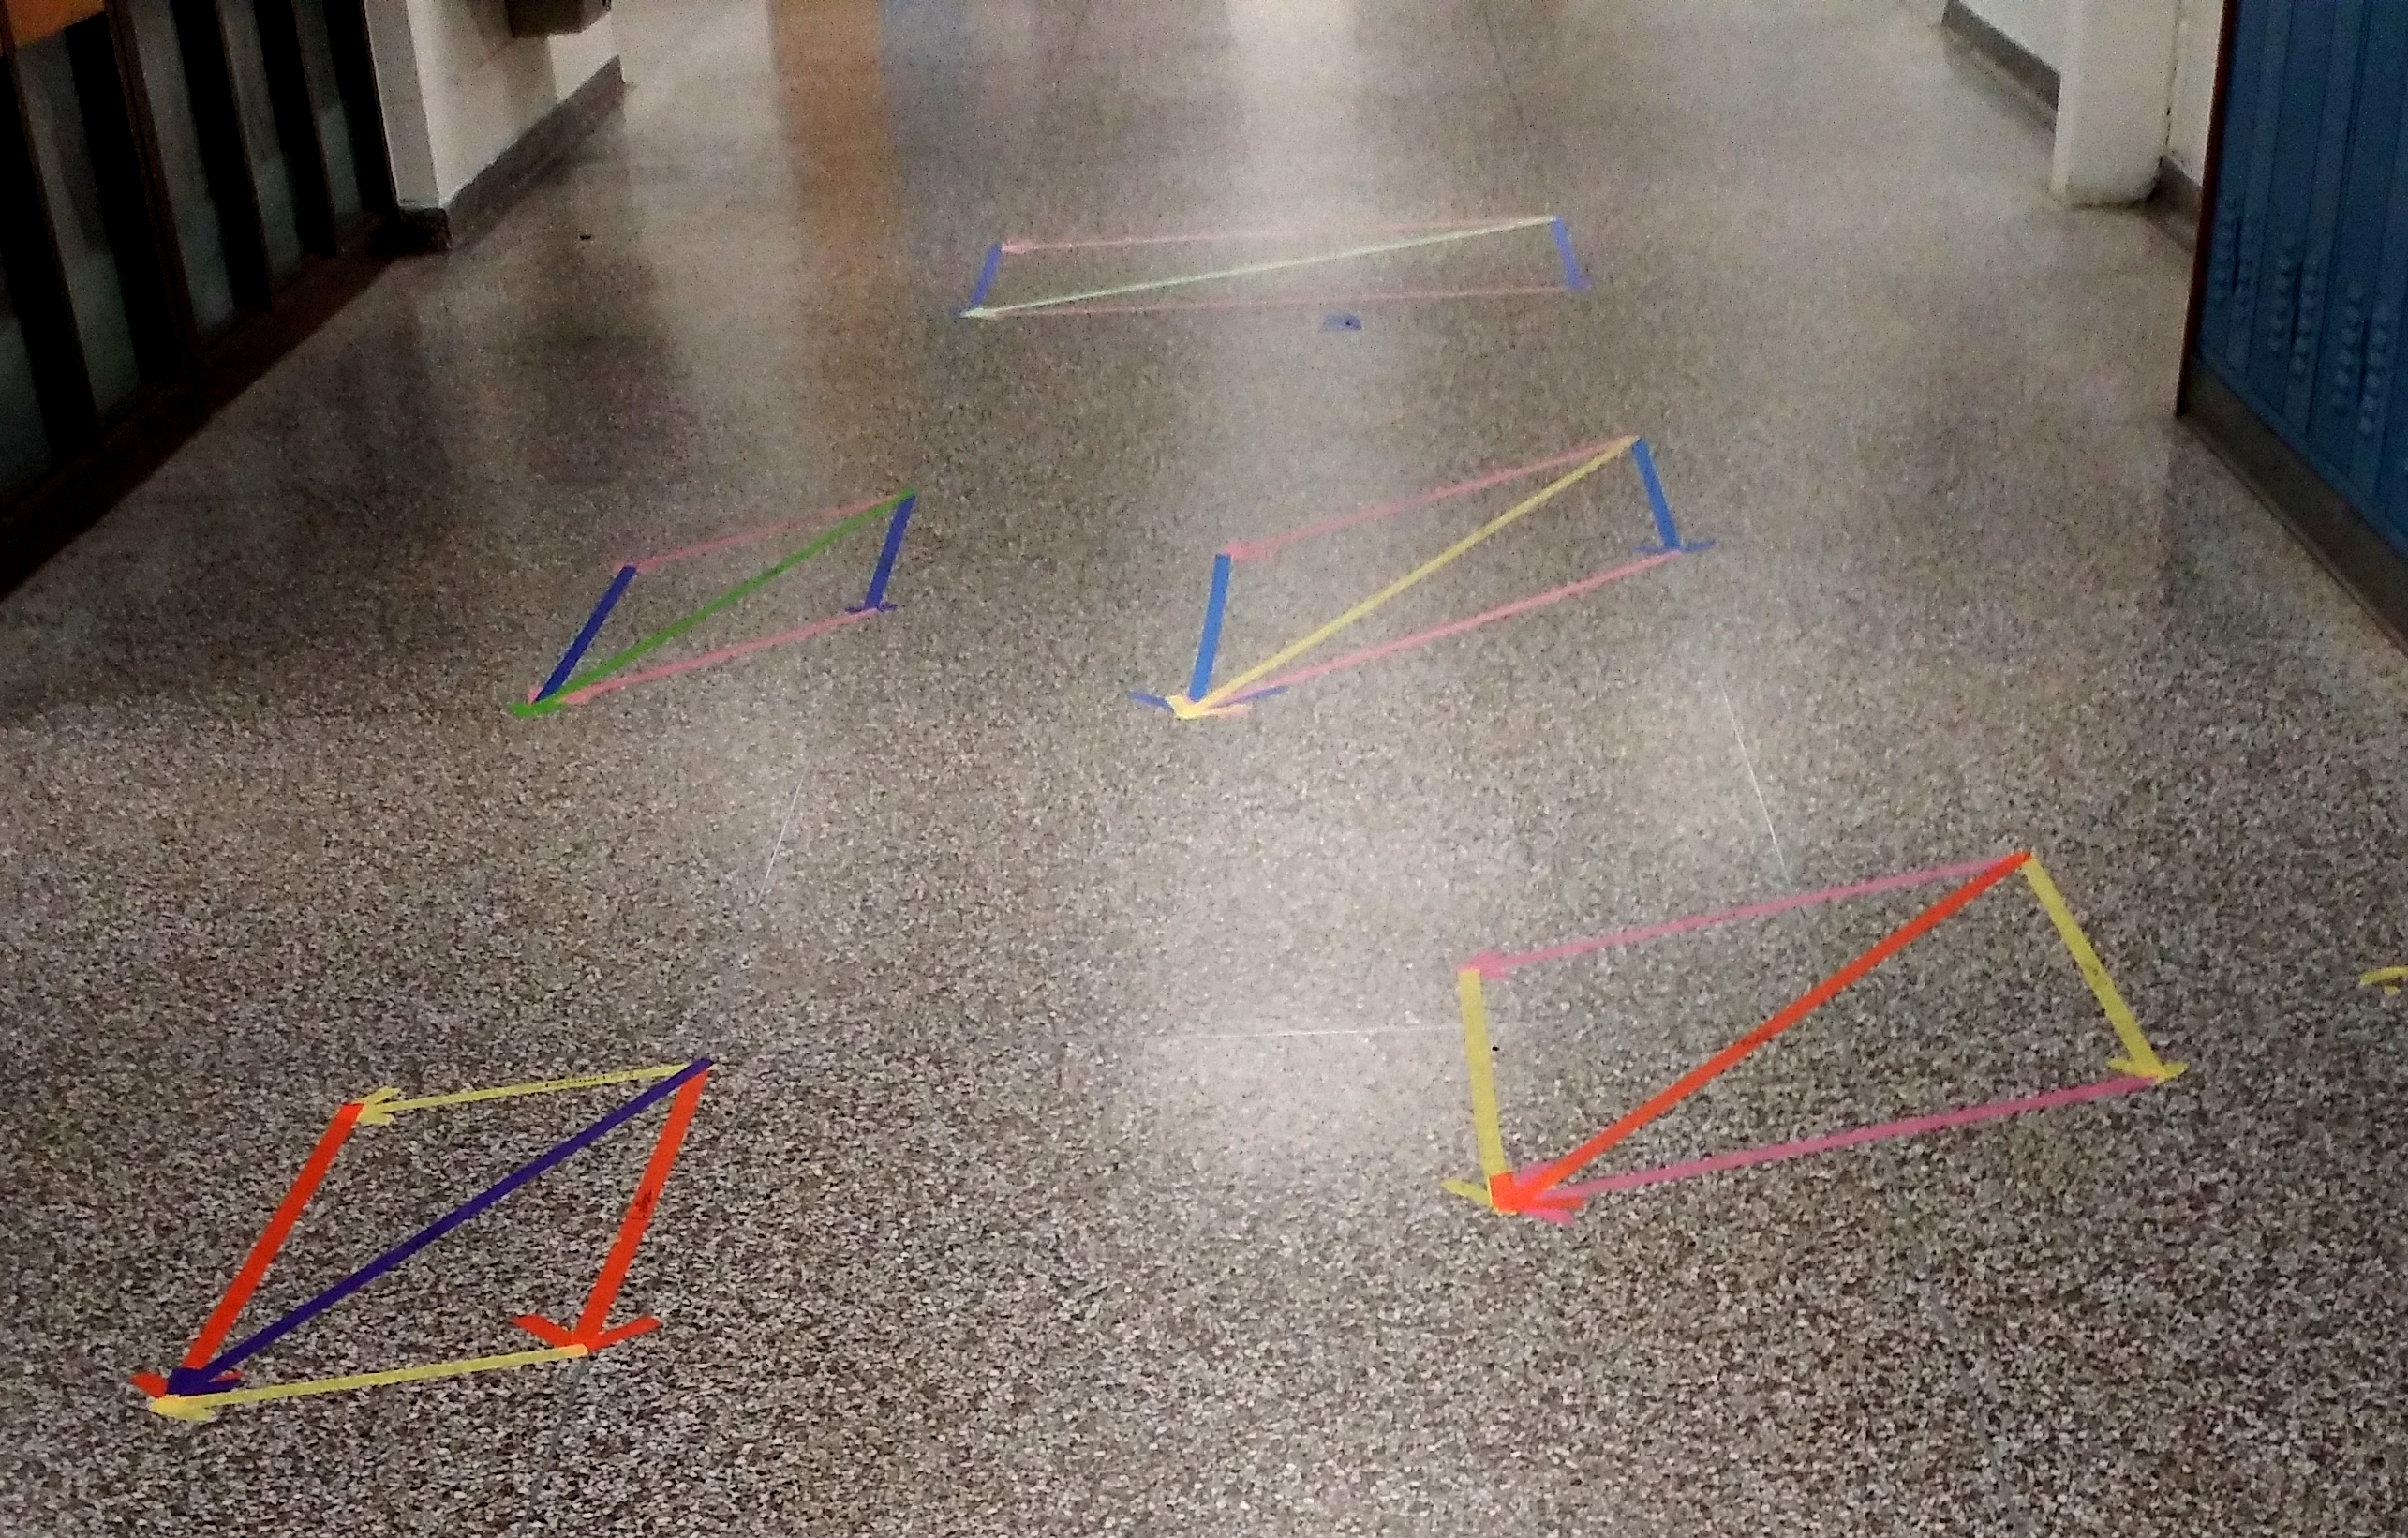 With a more advanced group you can use these arrows as a graphical approach to introducing trigonometry. And these arrows are also useful for depicting forces, like this:
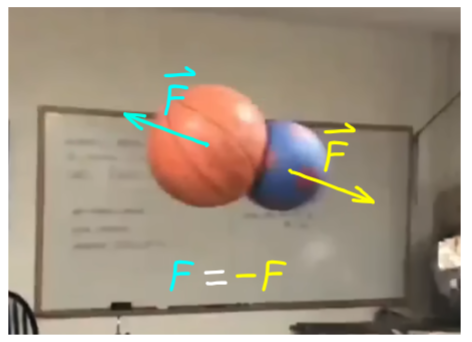 Since force can be defined as a change in momentum over time, it makes sense that I introduce force (specifically, Newton's Laws) at this point in the curriculum.
• • •
Then what is introduced next is work and energy, and a diagram that I call The Secret to the Universe. Eventually this will also involve arrows, but ones that are quite different.Part 4: The Secret to the Universe ➤
The Secret to the Universe starts with an unassuming equation with big implications:
Work = Force · distance
If you push on something, and it moves (in the direction you pushed), then you have done work. If the object didn't move, no matter how hard or for how long you pushed, you did no work.
This equation can be easily represented using the triangle format, but that's not all of the story. Once you know how much work was done, you can then wonder how it was possible to do that work. It was only possible if you had the energy to do it. But doing the work cost you that energy. Where did it go? The object now has that energy. Now it can pass that energy to something else by doing work. This is the secret, and I like to represent it, of course, with a diagram:
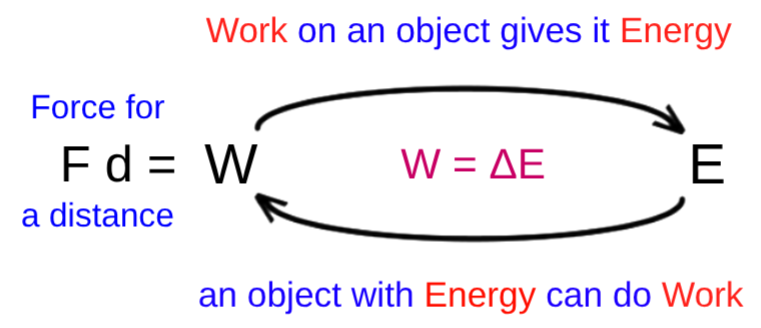
I want to be clear that energy is not a substance that gets passed around the universe. It's more like a way to keep score as objects interact with each other.
There is another trick involving energy: there are entities called force fields that are also part of this scorekeeping. Certain objects can affect other objects without being in actual contact. This is called force at a distance, and so we can speak of these objects as having force fields reaching out into space. It is within the interaction of these force fields, rather than of the objects themselves, where energy is transferred and transformed.
There are only four such forces. Gravity is the one we're most familiar with. Electricity and magnetism (two versions, really, of the same phenomenon) are also familiar, but usually operating more in the background. And there are two distinct atomic forces acting in and around the vicinity of atomic nuclei, the so-called strong and weak nuclear forces.
Part 5: Energy Diagrams ➤
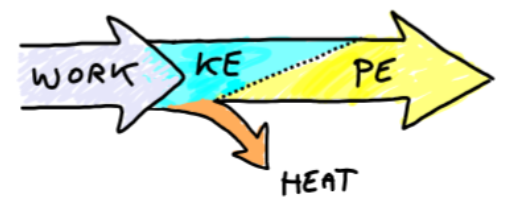
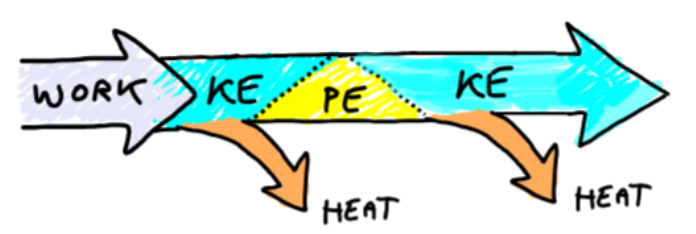
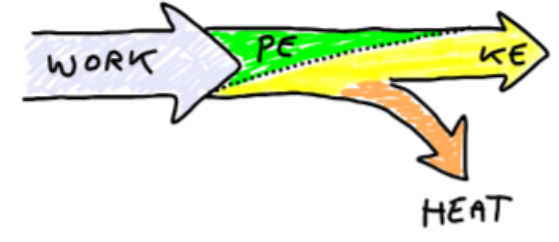
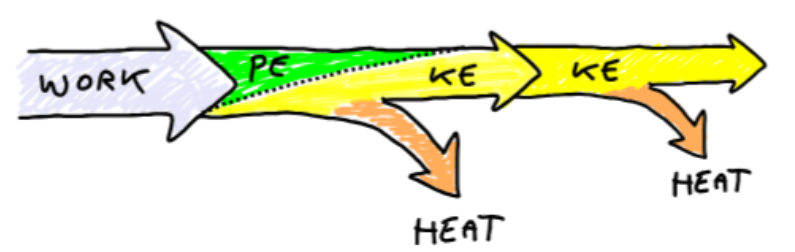
An arrow diagram for energy needs to be able to show both energy transfers as well as energy conservation. The direction of the arrow will always be to the right (to reflect the passage of time). The thickness of the arrow will represent the amount of energy. Color can be used to show kinetic energy (KE - the energy of motion) as distinct from potential energy (PE - stored energy). One arrow connecting to another arrow can show energy transfer from one object to another. Here are some examples:
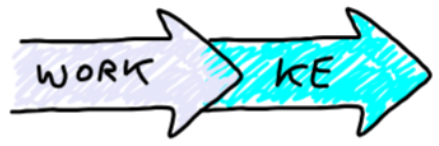
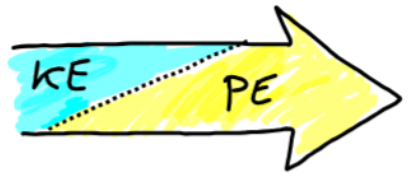

Notice that an object transforming KE to PE (or viceversa) is represented with a dotted line at an angle. This is because the transformation takes time.
Energy lost in the form of heat (which can't be recovered) is shown below with small arrows branching off. The heat arrows always branch off the KE part of the diagram (heat loss due mostly to friction):
Part 6: Electricity & Magnetism ➤
There is only one kind of kinetic energy: the energy of motion. But there are many sources of potential energy. In the last section (Part 5) you may have noticed the assumption of gravitational potential energy. (You may have also caught the one example of elastic potential energy.) Doing work on something gives it energy, but if that energy can be stored (if the force being worked against is restorative), the stored energy is called potential energy.
The restoring force that we live with, day and night, is gravity. Another such force we live with, whether we know it or not, are the electromagnetic forces, electricity and magnetism. Electrical and electromagnetic devices can be diagrammed in terms of electrical forces. But let's start with gravity again, and this time we'll make a box with the name of the interaction, and the energy transfer or transformation passing through it, like so:
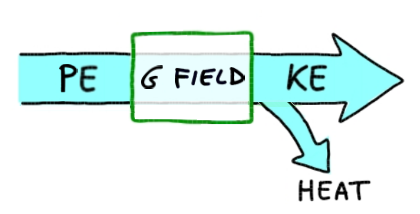 The hardest part for my students trying to read this is remembering to start with the gravitational interaction: "In a gravitational field, potential energy can be transformed to kinetic energy, with a (possible) loss of energy in the form of heat."
As you might expect, the same kind of energy diagram can be made for an electric field:
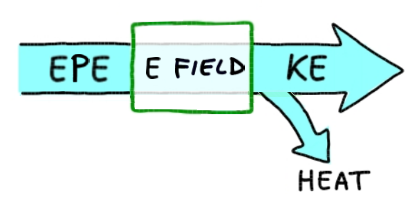 (Note that the heat arrow is outside of the interaction. The heat loss is due to other forces not part of the named interaction.)
These diagrams reveal a shift in emphasis from the earlier energy diagrams. The earlier diagrams focused on objects having kinds of energy. These diagrams focus on the fields that provide that energy.
• • •
At this point in the curriculum, we embark on a study of electricity and magnetism. We'll need to modify the energy diagram again: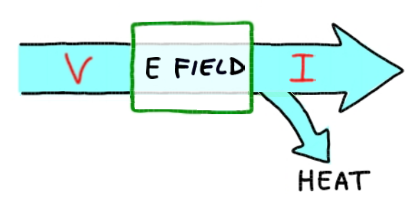
This modification is a bit of a leap, but it works well as we explore electromagnetism. Voltage, of course, is electric potential, which is closely related to potential energy. Current is the flow of electrons, which is itself a leap, since electrons don't really flow. But current implies motion, and therefore kinetic energy. Heat is the result of current. This diagram can be further modified to introduce the next phenomenon, namely magnetism:
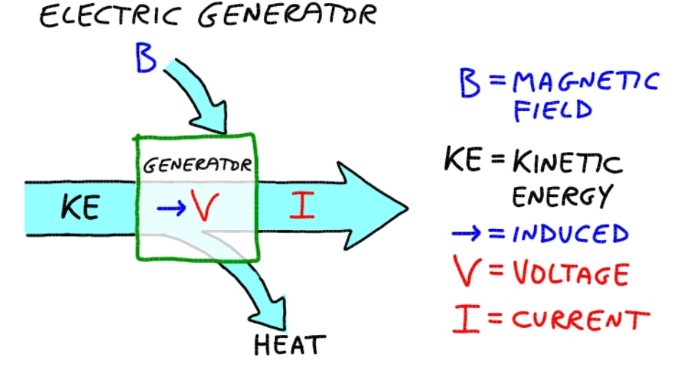
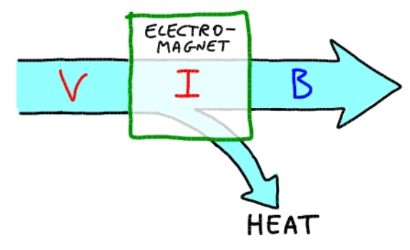 I am taking more liberties here. The letter B stands for the magnetic field, of course, which is a product of current. The magnetic field itself is not a form of energy, but it stores magnetic energy. Without getting into the weeds (for an introductory physics course), I use the letter B as if it were energy.
• • •
I continue using variations on this diagram as the students explore various electromagnetic phenomena and devices. The box in the middle will now indicate a specific device rather than a field.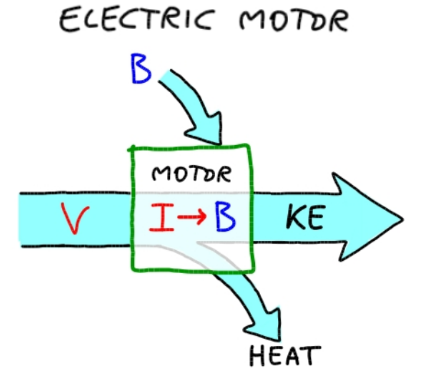
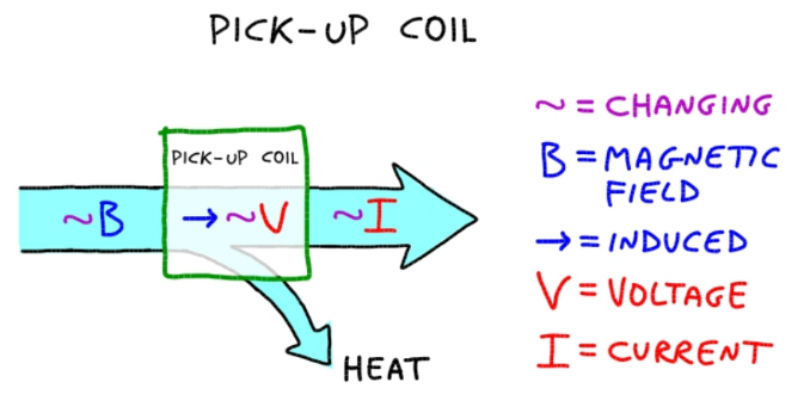 Pick-up coils can be really small, so they often go unnoticed, but they are ubiquitous. The pick-up coil also plays an important role in the next device:
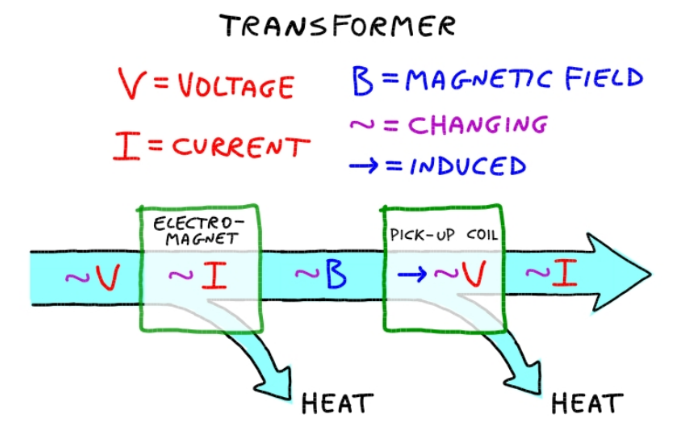 Transformers are also ubiquitous, but can range in size from small to gigantic. They are the trashcan-looking objects up on the telephone poles. Large ones are often in metal boxes enclosed in a chain-link fence with a danger sign attached. They often hum like crazy. Every gasoline-powered car has a little one - it's called the ignition coil. And all those blocks and chargers you have for your electronic devices are transformers. One voltage is applied to a transformer as input and a different voltage becomes available as output.
• • •
This final device works like a transformer, but the energy can travel through space as an electro-magnetic (EM) wave, or EM radiation. This means that the transmitting part can be separate from the receiving part. How far can the energy go? If it isn't absorbed by something, it can travel forever. How fast does it go? It travels at the speed of light.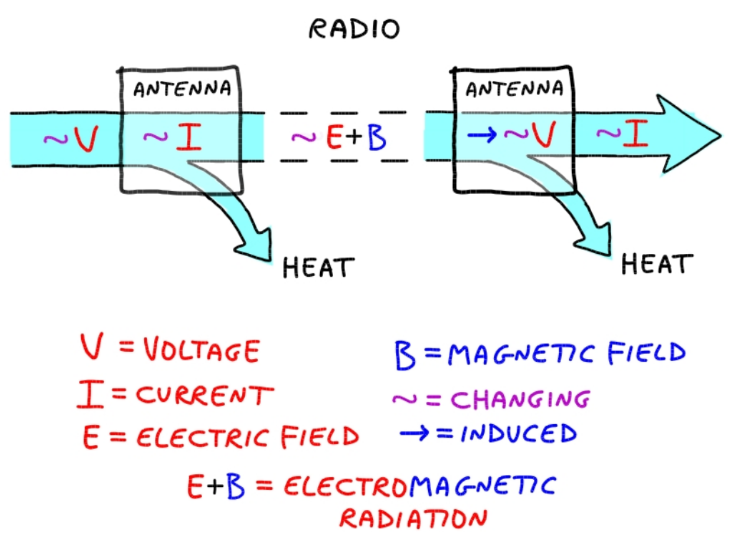
Very distant stars act as antennas, sending EM radiation into space. This radiation includes visible light, which travels out in all directions. If you look up at night at the stars, a tiny bit of this light enters your eyes. Your eyes are also antennas, receiving the energy from the star's light, thus completing the transformation.
• • •
Project #2: New Physics Curriculum ➤
I was tasked back in 2019 with redesigning the physics curriculum at my school. Our state (MA) had just upgraded their framework, so we needed to re-align. For the last decade, the state's framework was nothing more than a shopping cart of physics topics. There wasn't even an attempt to distinguish topics from concepts or equations. The state assessment required students to have key vocabulary memorized, and to know how to pick out the right equation and apply it correctly to word problems. And that was about it.
My physics team has only three members. For good or for ill, we are all well-versed in the old state framework and assessment. The new framework is mostly based on the Next Generation Science Standards, so it’s quite different. I was excited about the change, because I think the NGSS is a worthy approach. But it’s very different from the old approach, and I wanted the team to have the time and opportunity to adapt. The new curriculum I wrote is organized in a way that looks similar to the old curriculum, but introduces and adapts the new framework language. The team already has a strong bias toward hands-on, project-based, team-oriented classwork. I wanted the physics team to continue moving in that direction, but to shift their conception of this project-based classwork from demonstration-of-topic to phenomenon-model-interaction.
To help our team, perhaps other science teams, and even our supervisors, to better understand the NGSS framework, I created a concept diagram. The diagram is not based directly on the NGSS framework, but is instead a representation of the new curriculum I wrote. I think of the new curriculum as a particular instance of the NGSS framework.

The old curriculum thinking was topic first, application second. The new curriculum flips that around to phenomenon first, model second. The basic interaction is that the phenomenon informs the model, and the model makes predictions about the phenomenon. We choose an anchor phenomenon that is sufficiently complex, has relevance to the lives of the students, and is interesting or engaging. As an aid in exploring this phenomenon, simpler and perhaps more accessible related phenomena are introduced.
The model is related to other models, largely through shared concepts such as force and energy. Through these core concepts, students can develop a picture of physics as a consistent viewpoint and approach to understanding the world, rather than merely a collection of topics. The model is represented and expressed in many ways. These multiple representations give students multiple pathways for exploring the relationship between model and phenomenon.
Finally, in keeping with the idea that learning comes from doing, I include a summary of what students could do as they explore the phenomenon-model relationship. This list is broadly in line with the goals stated in the standards of the new state framework.
